
Lesson guide
Learning objectives
- Explain the main purpose of Developer console in JavaScript.
- Identify the syntax, APIs, or concepts introduced in this lesson.
- Use the examples to predict how JavaScript will behave before you run similar code.
- Connect this topic to nearby lessons in An introduction.
Real-world context
This lesson matters when you need to recognize where Developer console fits into real JavaScript programs. Code is prone to errors.
Key ideas
- Developer console is part of the An introduction chapter, so it builds on the surrounding concepts rather than standing alone.
- Read each code example in two passes: first for the result, then for the rule that explains the result.
- When a section compares similar features, focus on the condition that makes you choose one feature over another.
Key terms
- Developer console
- Developer
- console
- An introduction
- JavaScript
Code is prone to errors. You will quite likely make errors… Oh, what am I talking about? You are absolutely going to make errors, at least if you’re a human, not a robot.
But in the browser, users don’t see errors by default. So, if something goes wrong in the script, we won’t see what’s broken and can’t fix it.
To see errors and get a lot of other useful information about scripts, “developer tools” have been embedded in browsers.
Most developers lean towards Chrome or Firefox for development because those browsers have the best developer tools. Other browsers also provide developer tools, sometimes with special features, but are usually playing “catch-up” to Chrome or Firefox. So most developers have a “favorite” browser and switch to others if a problem is browser-specific.
Developer tools are potent; they have many features. To start, we’ll learn how to open them, look at errors, and run JavaScript commands.
Google Chrome
Open the page bug.html.
There’s an error in the JavaScript code on it. It’s hidden from a regular visitor’s eyes, so let’s open developer tools to see it.
Press F12 or, if you’re on Mac, then Cmd+Opt+J.
The developer tools will open on the Console tab by default.
It looks somewhat like this:
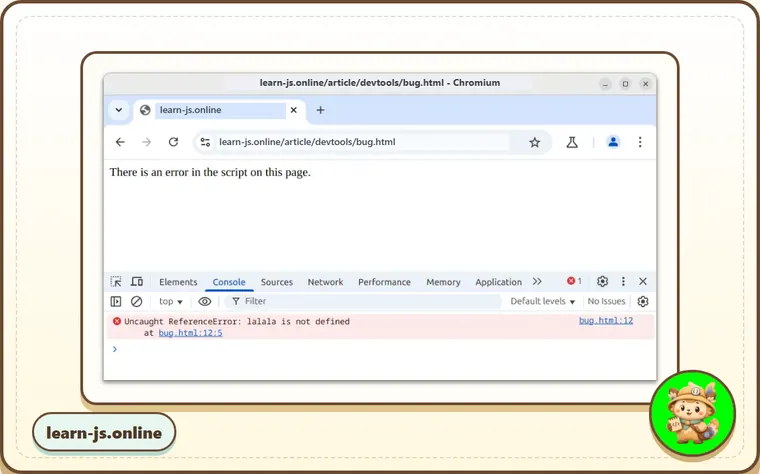
The exact look of developer tools depends on your version of Chrome. It changes from time to time but should be similar.
- Here we can see the red-colored error message. In this case, the script contains an unknown “lalala” command.
- On the right, there is a clickable link to the source
bug.html:12with the line number where the error has occurred.
Below the error message, there is a blue > symbol. It marks a “command line” where we can type JavaScript commands. Press Enter to run them.
Now we can see errors, and that’s enough for a start. We’ll come back to developer tools later and cover debugging more in-depth in the chapter Debugging in the browser.
Multi-line input
Usually, when we put a line of code into the console, and then press Enter, it executes.
To insert multiple lines, press Shift+Enter. This way one can enter long fragments of JavaScript code.
Firefox, Edge, and others
Most other browsers use F12 to open developer tools.
The look & feel of them is quite similar. Once you know how to use one of these tools (you can start with Chrome), you can easily switch to another.
Safari
Safari (Mac browser, not supported by Windows/Linux) is a little bit special here. We need to enable the “Develop menu” first.
Open Settings and go to the “Advanced” pane. There’s a checkbox at the bottom:
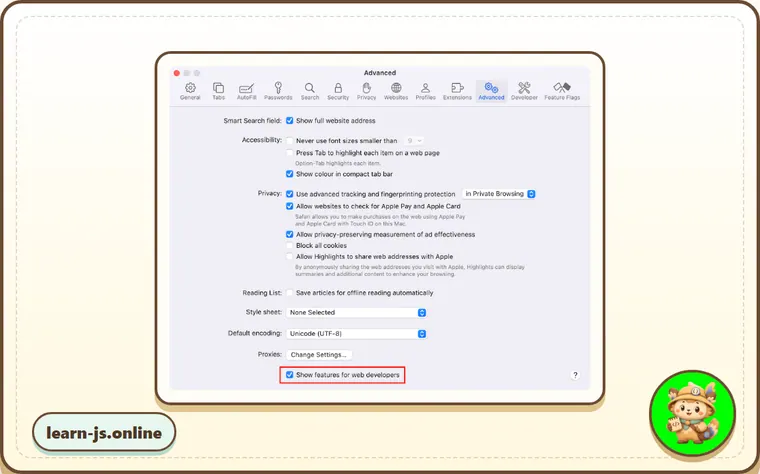
Now Cmd+Opt+C can toggle the console. Also, note that the new top menu item named “Develop” has appeared. It has many commands and options.
Common mistakes
- Skipping the small examples and then missing the exact rule that Developer console depends on.
- Copying code without changing one value at a time to see which part controls the result.
- Treating similar-looking syntax or APIs as interchangeable before checking their edge cases.
Summary
- Developer tools allow us to see errors, run commands, examine variables, and much more.
- They can be opened with
F12for most browsers on Windows. Chrome for Mac needsCmd+Opt+J, Safari:Cmd+Opt+C(need to enable first).
Now we have the environment ready. In the next section, we’ll get down to JavaScript.
Practice
- Rewrite one example from this lesson without looking at the original, then run it and compare the result.
- Change one input, operator, method call, or option in a code sample and predict what will happen before running it.
- Explain Developer console in your own words as if you were reviewing it with another learner.
Active code check
Predict
Before running, predict the final value of total. Then imagine where you would set a breakpoint to inspect it halfway.
Reveal explanation
DevTools is most useful when you can pause between statements. After the first +=, total is 2; after the second, it is 5.
Try it
Change the second increment from 3 to 10, then reread and use the output as a quick check of your mental trace.
Keep learning
Continue with Hello, world! when you are ready for the next lesson.